
February 16, 2026
From Podcast to Pipeline: How B2B Teams Should Measure Podcast ROI

If you are a B2B founder, you have likely stared at your podcast dashboard and asked yourself the same nagging question: "Is this actually working?"
You see the download chart creeping up. You see a few likes on LinkedIn. But when you look at your revenue numbers, the line isn't quite as clear.
This is the "Valley of Death" for B2B podcasts. Most companies treat their show like a media asset obsessing over download counts, CPM (Cost Per Mille), and reach. But you aren't a media company selling ad space; you are a B2B company selling high-value solutions.
At Reo.fm, we believe that for B2B founders, a podcast isn't just a broadcast channel. It is a business development engine.
If you are judging your success solely by Spotify metrics, you are likely undervaluing your show’s impact on your bottom line. It is time to stop measuring your podcast like a You Tuber and start measuring it like a CRO.
Here is the definitive guide to measuring B2B Podcast ROI.
The Vanity Metric Trap
The biggest mistake B2B teams make is confusing Audience with Pipeline.
In the consumer world, 10,000 downloads is a modest start. In the B2B world, 10,000 downloads is often irrelevant if none of those listeners can buy your product. Conversely, 100 downloads from the right VPs of Engineering or Heads of Sales can generate millions in Annual Recurring Revenue.
Why Standard Analytics Fail B2B
Standard hosting platforms (like Anchor, Libsyn, or Transistor) provide "vanity metrics." They tell you how many people listened, but they cannot tell you who listened or why it matters.
Furthermore, B2B buying journeys are non-linear and famously plagued by Dark Social.
- A prospect listens to your episode on their commute.
- They saw a clip of it on LinkedIn two weeks later.
- Three months later, they have a budget approval and type your URL directly into their browser.
Google Analytics will attribute that sale to "Direct Traffic." Your podcast hosting provider won't see it at all. If you rely on these tools alone, your podcast ROI looks like zero, even when it was the primary driver of the deal.
The Reo Framework: 3 Tiers of B2B Podcast ROI
To capture the true value of your show, you need a new framework. We break podcast ROI down into three distinct tiers: Direct Revenue, Attribution, and Content Asset Value.
Tier 1: Direct Revenue ROI (The "Guest-to-Pipeline" Motion)
This is the most overlooked but most potent source of ROI for B2B founders. Your podcast is a networking tool that allows you to have 45-minute conversations with your Ideal Customer Profile (ICP) without being "salesy."
If you invite a prospect to be a guest, you are building a relationship, not just an episode.
How to Measure It
Metric: Guest Conversion Rate.
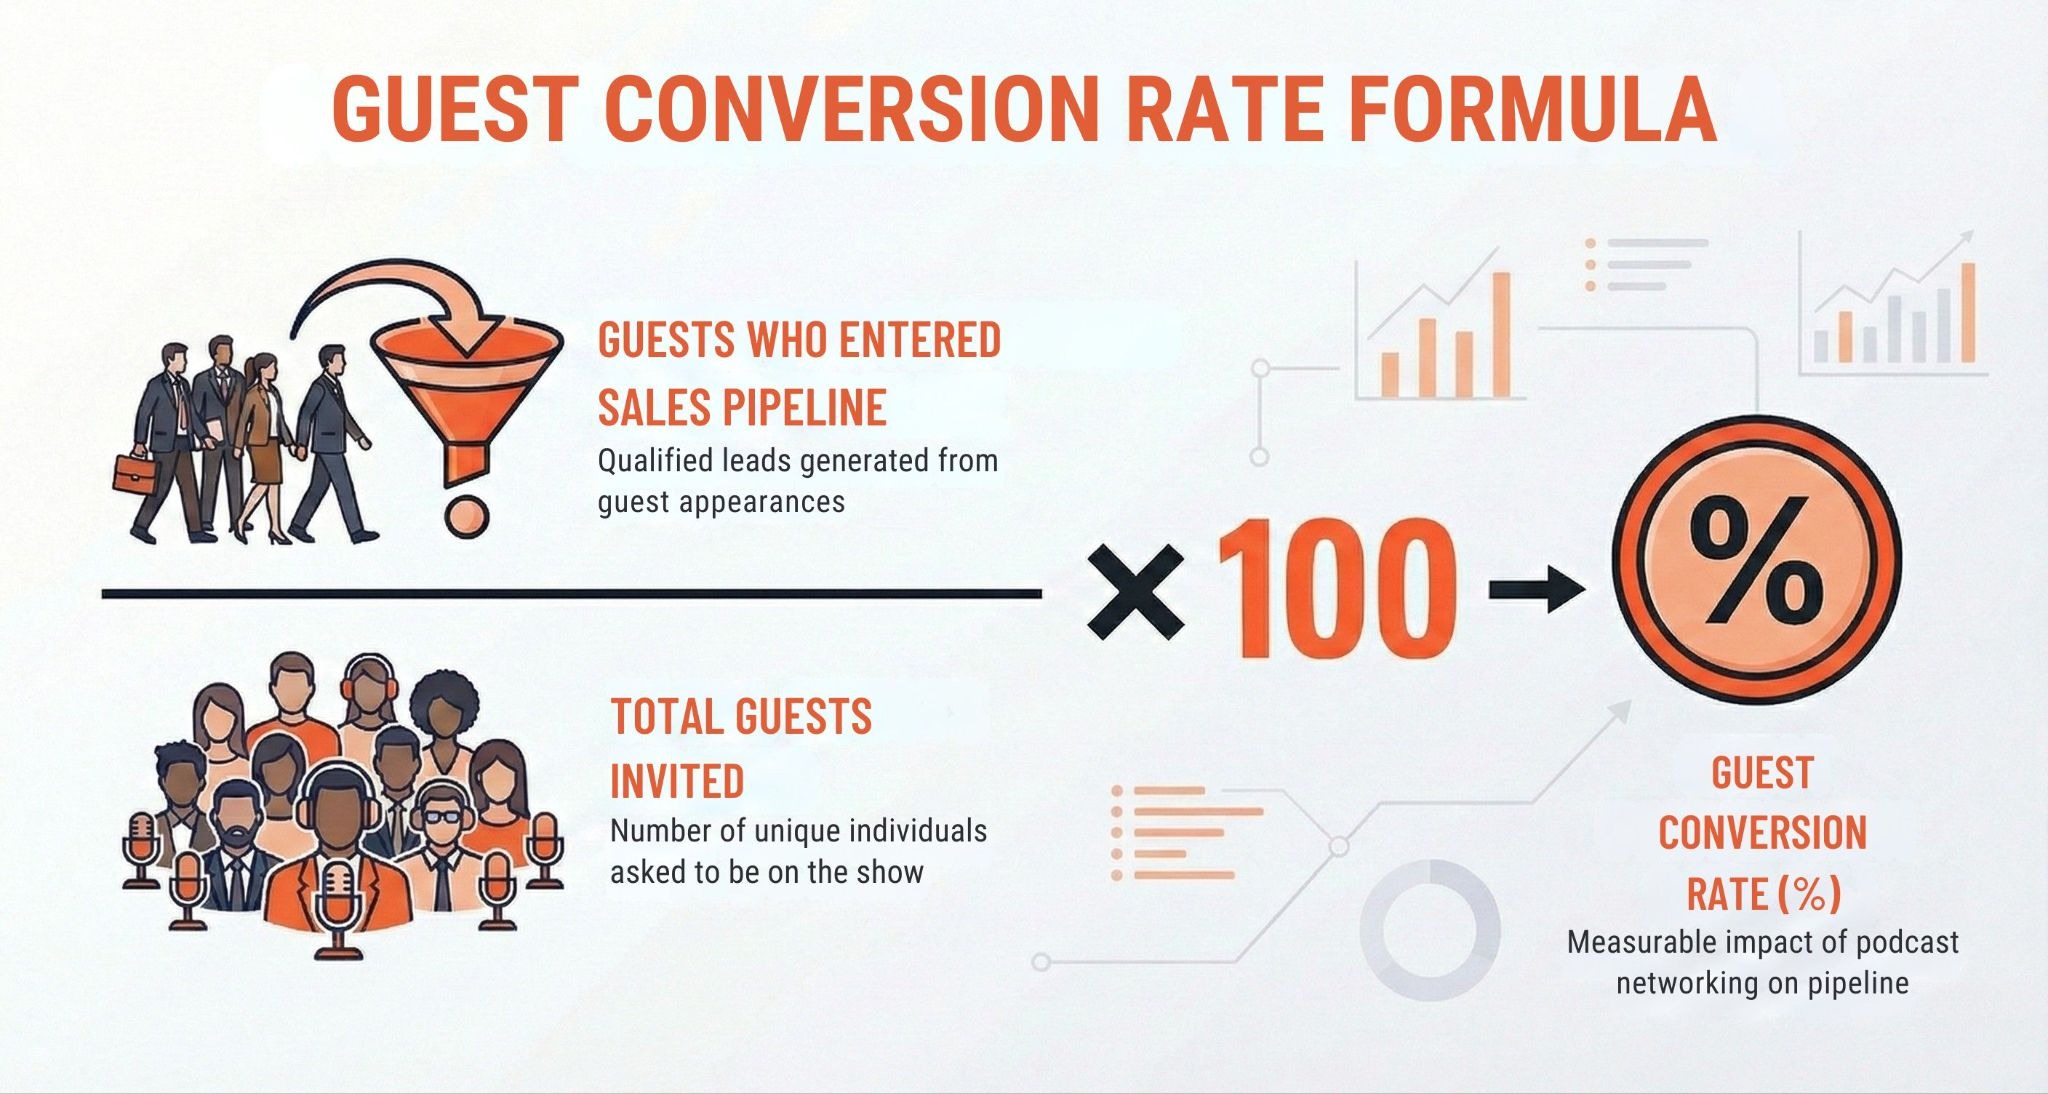
Where to Track: In your CRM (Hub Spot/Sales force), tag every podcast guest with a specific "Campaign Source."
Track their movement from Podcast Guest → Opportunity → Closed Won.
Tier 2: Attribution ROI (The "Listener-to-Lead" Motion)
This tier captures the "Dark Social" impact - the people listening who you didn't interview. Since digital tracking (cookies/pixels) often fails here, you must rely on Zero-Party Data (data the customer voluntarily gives you).
How to Measure It
- Metric: Self-Reported Attribution.
- The Tactic: Add an open-text field to your demo request or contact form that asks: "How did you hear about us?"
- Why it works: Drop-down menus are restrictive. An open text field allows a prospect to say, "I heard your CEO on the [Show Name] podcast talking about supply chain logistics."
- Valuation: Assign a dollar value to every lead that explicitly mentions the podcast.
Tier 3: Content Asset ROI (The Efficiency Motion)
Marketing is expensive. Creating high-quality LinkedIn posts, newsletters, and blog articles requires time and money. A podcast acts as a "content waterfall," providing source material for all other channels.
How to Measure It
- Metric: Cost Savings & Engagement.
- The Calculation: Compare the cost of producing one episode versus the cost of hiring a copywriter or agency to create 10 LinkedIn posts, 2 blog articles, and 3 video clips from scratch.
- Bonus Metric: Sales Enablement Velocity. Track how often your sales team uses specific episodes to handle objections. If sending an episode shortens a sales cycle by two weeks, that is measurable ROI.
Podcast ROI Calculator — Reo.fm *, *::before, *::after { box-sizing: border-box; margin: 0; padding: 0; } :root { --off-white: #F5F5F5; --white: #FFFFFF; --charcoal: #2D2D2D; --gray: #666666; --gray-light: #999999; --border: #E0E0E0; --orange: #EF4E23; --orange-light: rgba(239,78,35,0.10); --yellow: #FDB913; --yellow-light: rgba(253,185,19,0.14); --green: #10B981; --green-light: rgba(16,185,129,0.10); } body { font-family: 'Inter', Arial, sans-serif; background: var(--off-white); color: var(--charcoal); padding: 48px 24px 72px; line-height: 1.6; } .wrap { max-width: 780px; margin: 0 auto; } .header { margin-bottom: 40px; } .reo-tag { display: inline-flex; align-items: center; gap: 8px; margin-bottom: 16px; } .reo-icon { display: flex; align-items: flex-start; gap: 2px; } .reo-icon span { display: block; width: 8px; height: 8px; border-radius: 50% 50% 50% 0; } .reo-icon span:first-child { background: var(--orange); } .reo-icon span:last-child { background: var(--yellow); transform: translateX(-3px) translateY(3px); } .reo-word mark { font-size: 13px; font-weight: 700; color: var(--charcoal); letter-spacing: 0.04em; } .tag-divider { width: 1px; height: 14px; background: var(--border); } .tag-label { font-size: 11px; font-weight: 500; color: var(--gray); letter-spacing: 0.06em; text-transform: uppercase; } .header h1 { font-size: 28px; font-weight: 700; color: var(--charcoal); letter-spacing: -0.02em; margin-bottom: 10px; line-height: 1.2; } .header h1 span { color: var(--orange); } .header p { font-size: 15px; color: var(--gray); line-height: 1.65; max-width: 580px; } .inputs { display: grid; grid-template-columns: 1fr 1fr; gap: 12px; margin-bottom: 24px; } .inp-card { background: var(--white); border: 1px solid var(--border); border-radius: 12px; padding: 16px 18px; } .inp-card.full { grid-column: 1 / -1; } .inp-top { display: flex; justify-content: space-between; align-items: center; margin-bottom: 12px; } .inp-name { font-size: 12px; font-weight: 500; color: var(--gray); } .inp-val { font-size: 14px; font-weight: 700; color: var(--charcoal); background: var(--off-white); border: 1px solid var(--border); border-radius: 20px; padding: 3px 12px; min-width: 68px; text-align: center; } input[type=range] { -webkit-appearance: none; appearance: none; width: 100%; height: 3px; background: var(--border); border-radius: 2px; outline: none; cursor: pointer; } input[type=range]::-webkit-slider-thumb { -webkit-appearance: none; appearance: none; width: 18px; height: 18px; border-radius: 50%; background: var(--orange); cursor: pointer; border: 2px solid var(--white); box-shadow: 0 0 0 1px var(--border); } input[type=range]::-moz-range-thumb { width: 18px; height: 18px; border-radius: 50%; background: var(--orange); cursor: pointer; border: 2px solid var(--white); } .metrics { display: grid; grid-template-columns: repeat(4, minmax(0,1fr)); gap: 12px; margin-bottom: 12px; } .metric { background: var(--white); border: 1px solid var(--border); border-top: 3px solid var(--border); border-radius: 12px; padding: 16px; } .metric.orange { background: var(--orange-light); border-color: rgba(239,78,35,0.20); border-top-color: var(--orange); } .metric.yellow { background: var(--yellow-light); border-color: rgba(253,185,19,0.25); border-top-color: var(--yellow); } .metric.green { background: var(--green-light); border-color: rgba(16,185,129,0.20); border-top-color: var(--green); } .metric-label { font-size: 10px; font-weight: 600; letter-spacing: 0.08em; text-transform: uppercase; color: var(--gray); margin-bottom: 8px; } .metric.orange .metric-label { color: #B83000; } .metric.yellow .metric-label { color: #9A6E00; } .metric.green .metric-label { color: #047857; } .metric-val { font-size: 24px; font-weight: 700; letter-spacing: -0.03em; color: var(--charcoal); line-height: 1; margin-bottom: 4px; } .metric.orange .metric-val { color: var(--orange); } .metric.yellow .metric-val { color: #C98A00; } .metric.green .metric-val { color: var(--green); } .metric-note { font-size: 10px; color: var(--gray-light); line-height: 1.4; margin-top: 5px; } .metric.orange .metric-note { color: rgba(239,78,35,0.55); } .metric.yellow .metric-note { color: rgba(180,120,0,0.55); } .metric.green .metric-note { color: rgba(16,185,129,0.6); } .ratio-card { background: var(--charcoal); border-radius: 12px; padding: 20px 22px; margin-top: 12px; margin-bottom: 24px; } .ratio-top { display: flex; justify-content: space-between; align-items: center; margin-bottom: 12px; flex-wrap: wrap; gap: 8px; } .ratio-label { font-size: 12px; color: rgba(255,255,255,0.5); font-weight: 500; } .ratio-nums { font-size: 12px; color: rgba(255,255,255,0.5); } .ratio-nums strong { color: #fff; font-weight: 600; } .ratio-track { height: 6px; background: rgba(255,255,255,0.12); border-radius: 3px; overflow: hidden; } .ratio-fill { height: 100%; border-radius: 3px; background: var(--orange); transition: width 0.4s ease; } .ratio-fill.warn { background: rgba(255,255,255,0.3); } .chart-card { background: var(--white); border: 1px solid var(--border); border-radius: 12px; padding: 20px 22px; margin-bottom: 24px; } .chart-top { display: flex; justify-content: space-between; align-items: center; margin-bottom: 16px; flex-wrap: wrap; gap: 8px; } .chart-label { font-size: 12px; font-weight: 600; color: var(--gray); } .legend { display: flex; gap: 16px; } .legend-item { display: flex; align-items: center; gap: 6px; font-size: 11px; color: var(--gray); } .legend-sq { width: 10px; height: 10px; border-radius: 2px; flex-shrink: 0; } .chart-wrap { position: relative; width: 100%; height: 200px; } .breakdown { background: var(--white); border: 1px solid var(--border); border-radius: 12px; padding: 20px 22px; margin-bottom: 12px; } .breakdown-title { font-size: 10px; font-weight: 700; letter-spacing: 0.1em; text-transform: uppercase; color: var(--gray); margin-bottom: 14px; } .brow { display: flex; justify-content: space-between; align-items: center; padding: 10px 0; border-bottom: 1px solid var(--off-white); font-size: 13px; } .brow:last-child { border-bottom: none; } .brow-k { color: var(--gray); } .brow-v { font-weight: 600; color: var(--charcoal); } .brow.net { border-top: 2px solid var(--off-white); margin-top: 4px; padding-top: 14px; border-bottom: none; } .brow.net .brow-k { color: var(--charcoal); font-weight: 600; } .brow.net .brow-v { font-size: 15px; } .disclaimer { font-size: 11px; color: var(--gray-light); line-height: 1.65; margin-bottom: 32px; padding: 0 2px; } .cta-block { background: var(--charcoal); border-radius: 16px; padding: 32px 36px; display: flex; align-items: center; justify-content: space-between; gap: 24px; flex-wrap: wrap; position: relative; overflow: hidden; } .cta-block::before { content: ''; position: absolute; top: -40px; right: -40px; width: 180px; height: 180px; background: var(--orange); opacity: 0.08; border-radius: 50%; } .cta-left { flex: 1; min-width: 200px; position: relative; } .cta-eyebrow { font-size: 10px; font-weight: 700; letter-spacing: 0.12em; text-transform: uppercase; color: var(--orange); margin-bottom: 8px; } .cta-heading { font-size: 20px; font-weight: 700; letter-spacing: -0.02em; color: #fff; line-height: 1.25; margin-bottom: 8px; } .cta-sub { font-size: 13px; color: rgba(255,255,255,0.5); line-height: 1.6; } .cta-btn { display: inline-block; background: var(--orange); color: #fff; font-family: 'Inter', Arial, sans-serif; font-size: 14px; font-weight: 600; padding: 13px 26px; border-radius: 8px; text-decoration: none; white-space: nowrap; transition: background 0.2s; letter-spacing: 0.01em; border: none; cursor: pointer; position: relative; } .cta-btn:hover { background: #D43E18; } @media (max-width: 580px) { body { padding: 32px 16px 56px; } .inputs { grid-template-columns: 1fr; } .inp-card.full { grid-column: 1; } .metrics { grid-template-columns: 1fr 1fr; } .cta-block { flex-direction: column; } .cta-block::before { display: none; } }
rēo.fm Pipeline Calculator
What could your podcast
generate in pipeline?
Plug in your numbers to see what a B2B podcast targeting your ICP accounts could generate over 12 months — based on real client results.
Monthly retainer $4,000
Guests per month 6
Guests who become warm leads 15%
Lead close rate 20%
Average deal value $25,000
Annual cost
$48K
Pipeline generated
$54K
Opportunity value, not closed revenue
Opportunities / yr
2.2
Pipeline ROI
+13%
Based on pipeline, not closed revenue
Cost vs. pipeline generated $48K cost · $54K pipeline
Cumulative pipeline vs. cost — 12 months
Pipeline Cost
Cumulative pipeline grows month over month versus running cost.
How the math works
Annual guests72
Warm leads generated10.8
Opportunities created2.2
Pipeline value (opps x ACV)$54,000
Annual podcast cost$48,000
Pipeline payback periodn/a
Net pipeline vs. cost$6,000
Pipeline ROI measures opportunity value created relative to investment. Actual revenue ROI will vary based on your close rate and sales cycle length. Based on Reo.fm client results across B2B SaaS accounts.
Ready to build yours?
See what your podcast
pipeline could look like.
Reo.fm builds and runs B2B podcasts that open doors with ICP accounts. One 45-minute conversation. Weeks of pipeline-driving content.
const fmt = n => n >= 1000000 ? '$' + (n/1000000).to Fixed(1) + 'M' : n >= 1000 ? '$' + Math.round(n/1000) + 'K' : '$' + Math.round(n); const fmt Full = n => '$' + Math.round(n).to Locale String(); let chart; function calc() { const retainer = +document.get ElementById('retainer').value; const guests = +document.get ElementById('guests').value; const lead rate = +document.get ElementById('lead rate').value / 100; const close rate = +document.get ElementById('close rate').value / 100; const deal = +document.get ElementById('deal').value; document.get ElementById('v-retainer').text Content = fmt(retainer); document.get ElementById('v-guests').text Content = guests; document.get ElementById('v-lead rate').text Content = Math.round(lead rate * 100) + '%'; document.get ElementById('v-close rate').text Content = Math.round(close rate * 100) + '%'; document.get ElementById('v-deal').text Content = fmt(deal); const annual Cost = retainer * 12; const annual Guests = guests * 12; const leads = annual Guests * lead rate; const opps = leads * close rate; const pipeline = opps * deal; const pipe Roi = annual Cost > 0 ? ((pipeline - annual Cost) / annual Cost) * 100 : 0; const payback = pipeline > 0 ? annual Cost / (pipeline / 12) : null; const net = pipeline - annual Cost; document.get ElementById('m-cost').text Content = fmt(annual Cost); document.get ElementById('m-pipeline').text Content = fmt(pipeline); document.get ElementById('m-deals').text Content = opps.to Fixed(1); document.get ElementById('m-roi').text Content = (pipe Roi >= 0 ? '+' : '') + Math.round(pipe Roi) + '%'; const bar Pct = pipeline > 0 ? Math.min(95, Math.round((1 - annual Cost / Math.max(pipeline, annual Cost)) * 100)) : 0; const fill = document.get ElementById('ratio-fill'); fill.style.width = Math.max(2, bar Pct) + '%'; fill.class Name = 'ratio-fill' + (pipe Roi < 0 ? ' warn' : ''); document.get ElementById('rn-cost').text Content = fmt(annual Cost); document.get ElementById('rn-rev').text Content = fmt(pipeline); document.get ElementById('b-guests').text Content = annual Guests; document.get ElementById('b-leads').text Content = leads.to Fixed(1); document.get ElementById('b-closed').text Content = opps.to Fixed(1); document.get ElementById('b-rev').text Content = fmt Full(pipeline); document.get ElementById('b-cost').text Content = fmt Full(annual Cost); document.get ElementById('b-payback').text Content = payback ? (payback <= 1 ? '< 1 month' : payback.to Fixed(1) + ' months') : 'n/a'; const net El = document.get ElementById('b-net'); net El.text Content = fmt Full(net); net El.style.color = net >= 0 ? '#10B981' : '#EF4E23'; const labels = ['M1','M2','M3','M4','M5','M6','M7','M8','M9','M10','M11','M12']; const pipe Data = labels.map((_,i) => Math.round((pipeline / 12) * (i + 1))); const cost Data = labels.map((_,i) => Math.round(retainer * (i + 1))); if (chart) { chart.data.datasets[0].data = pipe Data; chart.data.datasets[1].data = cost Data; chart.update('none'); } else { chart = new Chart(document.get ElementById('roi Chart'), { type: 'line', data: { labels, datasets: [ { label: 'Pipeline', data: pipe Data, border Color: '#EF4E23', background Color: 'rgba(239,78,35,0.07)', fill: true, tension: 0.35, point Radius: 3, border Width: 2, point Background Color: '#EF4E23', }, { label: 'Cost', data: cost Data, border Color: '#BBBBBB', background Color: 'transparent', fill: false, tension: 0, point Radius: 2, border Width: 1.5, border Dash: [5, 4], point Background Color: '#BBBBBB', } ] }, options: { responsive: true, maintain Aspect Ratio: false, plugins: { legend: { display: false }, tooltip: { callbacks: { label: ctx => ' ' + fmt Full(ctx.parsed.y) } } }, scales: { x: { grid: { display: false }, ticks: { font: { size: 10, family: 'Inter' }, color: '#999999' } }, y: { grid: { color: 'rgba(0,0,0,0.05)' }, ticks: { font: { size: 10, family: 'Inter' }, color: '#999999', callback: v => fmt(v) } } } } }); } } ['retainer','guests','lead rate','close rate','deal'].for Each(id => document.get ElementById(id).add Event Listener('input', calc) ); calc();
Practical Implementation: Your Measurement Stack
You don't need a data science team to start tracking this. You just need to set up your infrastructure correctly.
- Modify Your CRM: Create a custom property for "Podcast Guest" status.
- Update Your Forms: Replace "Where did you find us?" drop downs with "How did you hear about us?" text fields.****
- Qualitative Listening: Pay attention to sales calls. If a prospect says, "I loved what you said about X in the last episode," that is a signal that your content is nurturing leads through the Middle of the Funnel (MOFU).
Good Read: How Founders Can Use Podcasts to Build Trust Before the First Sales Call
Real-World Scenarios: What Success Actually Looks Like
Let’s look at two hypothetical scenarios to illustrate why mindset matters.
Scenario A: The "Influencer" Approach
- Downloads: 15,000 per month.
- Audience: mostly students and entry-level employees.
- Revenue Attributed: $0.
- Verdict: High vanity, low value.
Scenario B: The "Reo" Approach
- Downloads: 300 per month.
- Audience: C-Suite executives in your niche.
- Action: You interviewed 10 potential clients; 2 of them signed contracts worth $50k each.
- Revenue Attributed: $100,000.
- Verdict: Low vanity, massive ROI.
Conclusion
Podcasting is not a brand awareness play; it is a pipeline play.
When you shift your focus from "getting famous" to "getting business," the metrics change. You stop worrying about going viral and start focusing on having high-quality conversations that convert.
Are you ready to stop shouting into the void and start building a pipeline?
We specialize in helping B2B founders turn their audio content into a measurable revenue asset. We handle the strategy and production so you can focus on closing the deals that come from it.
Spearhead founder-led growth in just 15 days.
Turn your expertise into a B2B podcast that drives pipeline, brand, and ICP relationships.
Book a free strategy session →